A controlled decoding of the pHin BLE GAP Interface
What we know so far
We know that the BLE Advertisement Manufacturer Specific Data option is 22 bytes long and is updated every 10 minutes with pool measurements. It is formatted as follows (Offset and Length are in Bytes):
Offset |
Length |
Data Type |
Format |
Comment |
|---|---|---|---|---|
0 |
2 |
Manufacturer ID |
uint16, LE |
|
2 |
7 |
Unknown |
||
9 |
1 |
Sequence Number |
uint8 |
Measurement sequence number, 0-255 |
10 |
4 |
Unknown |
||
14 |
6 |
Bluetooth Address |
6 bytes |
The Bluetooth Addr, with 1 bit difference |
20 |
2 |
Unknown |
We have three regions of unknown values are we still have to extract at least the following fields:
pH
ORP
Temperature
We have no idea where and how these values are encoded.
Are they encoded raw (pH and ORP in mV, temperature in Ohms), or are they converted to intrinsic pH and Celcius?
Are they encoded as (u)int16, (u)int32, floating point, fixed point, etc?
Are they byte-aligned, or squeezed across bytes to save as many bits as possible? There is a real possibility that there are not byte aligned because the BLE Advertisements are excatly 31 bytes long, which is the maximum allowed by the protocol. If they are at the limit, the designers might have been force squeeze the data (hopefully not compresssed…).
I have designed an emulator of the probe, which is a simple 3x DAC output controller by a Python GUI (see Probe Emulator)
The approach I will follow with the emulator is to:
Identify where each data is located by controlling only 1 parameter at a time while keeping the others fixed. Checking which parts of the payload respond to changes of the controlled parameter can tell us where the data is located.
Attempt to decode each field by tracking the real value of the controller parameter and comparing it with the encoded data.
Locating & Decoding the pH
In A naïve attempt at decoding the pHin BLE GAP Interface, it looked like bytes 7 and 8 were responding the most to variations of pH. Let’s control the pH more finely with our emulator to see if this holds true.
pH |
Probe mV |
ADC mV (T) |
ADC mV (M) |
Real pH |
BLE Payload B2-B12 |
|---|---|---|---|---|---|
10 |
-177.48 |
1302.52 |
1280 |
10.38 |
|
10.1 |
-183.396 |
1296.604 |
1273 |
10.50 |
|
10.2 |
-189.312 |
1290.688 |
1268 |
10.58 |
|
10.3 |
-195.228 |
1284.772 |
1262 |
10.68 |
|
10.4 |
-201.144 |
1278.856 |
1256 |
10.79 |
|
10.5 |
-207.06 |
1272.94 |
1249 |
10.90 |
|
10.6 |
-212.976 |
1267.024 |
1245 |
10.97 |
|
10.7 |
-218.892 |
1261.108 |
1239 |
11.07 |
|
10.8 |
-224.808 |
1255.192 |
1233 |
11.18 |
|
10.9 |
-230.724 |
1249.276 |
1228 |
11.26 |
|
11 |
-236.64 |
1243.36 |
1221 |
11.38 |
|
11.1 |
-242.556 |
1237.444 |
1215 |
11.48 |
|
With a 0.1 pH sweep, we can see something interesting happening in Byte 6. As the pH increases, Byte 6 decreases. After a bit a observation, we can notice that this byte has the same sensitivity as the mV. It looks like the least significant byte of a value representing the pH in millivolts:
It wraps from FF to 00 between 10.3 and 10.4 pH
Between pH 10 and pH 11, the total variation of this byte is
0x13 - 0x00plus0xFF - 0xd7, which is, in decimal a variation of 19+40 = 59 mV. -59mV/pH, doesn’t that ring a bell?
We have the LSB, but where is the rest of the data hiding? When the LSB wraps from 00 to FF, nothing really stands out in the nearby data to suggest that there are MSBs.
To find more significant bits, let’s continue varying the pH, but using larger steps this time.
pH |
Probe mV |
ADC mV (T) |
ADC mV (M) |
Real pH |
BLE Payload B2-B12 |
|---|---|---|---|---|---|
9 |
-118.32 |
1361.68 |
1340 |
9.37 |
|
8 |
-59.16 |
1420.84 |
1400 |
8.35 |
|
7 |
0 |
1480 |
1460 |
7.34 |
|
6 |
59.16 |
1539.16 |
1520 |
6.32 |
|
5 |
118.32 |
1598.32 |
1570 |
5.48 |
|
Note
I needed to save horizontal space in the above table. (T) = Theory, (M) = Measured on the scope
This sweep allows us to cycle one more time over a full least significant byte. We now have 2 “overflows” (for lack of a better term):
Between pH 10.3 and 10.4; then again between pH 7 and pH 6:
                    LSB  M
pH 10.3    82fb63e1 01  a5 5c03a60b5d
pH 10.4    822b64e1 fb  74 5c02ac0b5d

pH 6       82fb63e1 00  76 5c02a60b5d
pH 7       82fb63e1 c4  75 5c02a60b5d
Now that we have two examples of this overflow, we can spot what we are looking for. The second half-byte of the following byte seems to change by 1 in a consistent way in both cases. This is the half-byte (or “nibble”, precisely) that is marked with an M in the above dump.
If we interpret this as un unsigned 12-bit integer, we get:
pH |
Probe mV |
ADC mV (Theory) |
ADC mV (Scope) |
Real pH |
7[1] | 6[0:1] |
Decimal |
|---|---|---|---|---|---|---|
9 |
-118.32 |
1361.68 |
1340 |
9.37 |
0x54F |
1359 |
8 |
-59.16 |
1420.84 |
1400 |
8.35 |
0x588 |
1416 |
7 |
0 |
1480 |
1460 |
7.34 |
0x5C4 |
1476 |
6 |
59.16 |
1539.16 |
1520 |
6.32 |
0x600 |
1536 |
5 |
118.32 |
1598.32 |
1570 |
5.48 |
0x63C |
1596 |
Note
in the above table I use the syntax 7[1] | 6[0:1] to mean: the second half-byte of byte 7, concatenated with the second half-byte of byte 6.
We can see that there is a good match between our decoded 12-bit value and the theoretical voltage that is at the input of the ADC. So, we see that the probe announces its pH by reporting the mV value measured by the ADC, which is an efficient way to transport the data because it is unsigned and it is representable on only 12 bits.
Note
to push the compression further, the authors could have saved a couple more bits by subtracting a fixed offset to have a dynamic range between 0 and 1024, but apparently they were not that tight.
Locating & Decoding the ORP
Let’s move on to the ORP. We know what to look for, since the ORP can also be represented as a 12-bit millivolt value at the ADC input. We start by making a fine sweep to locate the LSB:
ORP mV |
ADC mV (Theory) |
ADC mV (Scope) |
payload B2-B9 |
400 |
1880 |
1860 |
82ab62e1c4 65 75 02 |
410 |
1890 |
1870 |
827b62e1c4 25 76 02 |
420 |
1900 |
1880 |
827b62e1c4 b5 76 02 |
430 |
1910 |
1890 |
827b62e1c4 75 77 02 |
440 |
1920 |
1900 |
827b62e1c4 35 78 02 |
450 |
1930 |
1910 |
827b62e1c4 95 78 02 |
There is something interesting happening in bytes 7 and 8:
                B7 B8
ADC mV 1880     65 75
ADC mV 1890     25 76
ADC mV 1900     b5 76
ADC mV 1910     75 77
ADC mV 1920     35 78
ADC mV 1930     95 78
We expect a variation of 10mV at the ADC input to produce a variation of 10 LSB in the encoded value. Recalling that the pH was encoded on the second nibble of Byte 7, let’s remove it and keep the three remaining nibbles. We can see that the first nibble of B7 is part of the LSB. If we combine it with B8 using B8[0:1] | B7[0] we get:
ADC mV 1880     0x758 = 1880
ADC mV 1890     0x762 = 1890
ADC mV 1900     0x76b = 1899
ADC mV 1910     0x777 = 1911
ADC mV 1920     0x783 = 1923
ADC mV 1930     0x789 = 1929
Looks like we are already onto something. Let’s test just a few more points across the whole range to double-check:
ORP mV |
ADC mV (Theory) |
ADC mV (Scope) |
|
Decimal |
|---|---|---|---|---|
100.00 |
1580 |
1560 |
0x620 |
1568 |
650.00 |
2130 |
2110 |
0x855 |
2133 |
850.00 |
2330 |
2310 |
827b62e1c4 b5 76 02 |
2325 |
It would seem that the BLE Advertisement contains the ADV voltage of the ORP pin, referenced to ground. To convert to ORP, we would need to subtract the voltage measured at the common pin, P0.02, to subtract the offset on the ORP probe, which is 1500mV.
Well, it turns out that there is a major flaw in the previous reasoning. I realized this when attempting to measure an ORP 225mV solution to double-check my experiment on the real sensor. To my surprise, I was reading out 225mV directly inside the BLE Advertisement. If my above reasoning was correct, I should have read 225mV + Common Offset (1500mV), which is 1750mV.
These results seemed so counter-intuitive that I spent 2 to 3 hours reproducing each result several times, taking notes, double checking my scope, probes, soldering… the PCB had undergone so many changes and hacks for all my tests that by this point practically every passive component on the analog frontend had already been unsoldered/resoldered and often times replaced, so I was suspecting a hardware fault somewhere, or some sort of measurement artifact. When our mind is confronted to what seems an impossible situation, we tend to come up the wildest theories to support our observations. More often than not, this kind cognitive dissonance can be easily resolved if we take a step back and try to identify an incorrect assumption. In this case, the incorrect assumption was that pH and ORP measurements are done simultaneously, in identical conditions. This simply cannot be true based on what we observe.
I was assuming that the ORP was measured during the 100 ms interval when the common point is biased at 1500mV through the R6/R5 resistive divider. In reality, the measurement takes place outside this interval, when J1- is pulled to GND. This can be either just before (as represented) or just after the pH measurement.
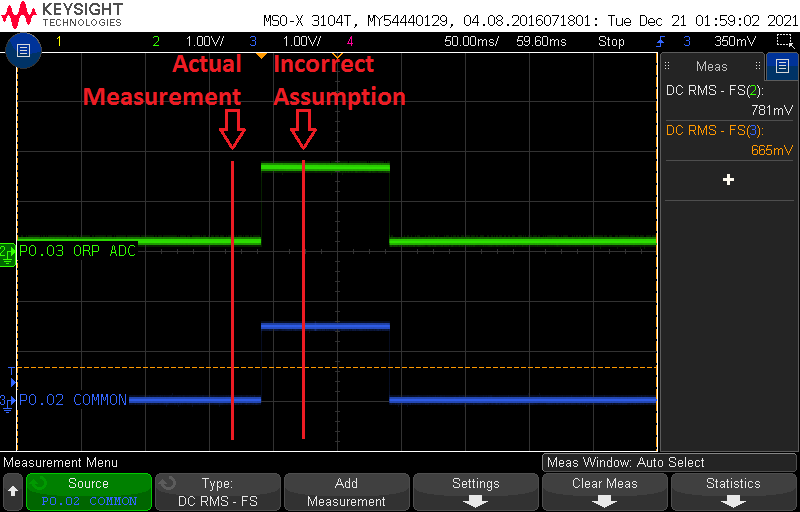
A differential measurement between P0.03 and P0.02 produces the same result in both cases, and it is the differential result that is reported in the BLE Advertisement.
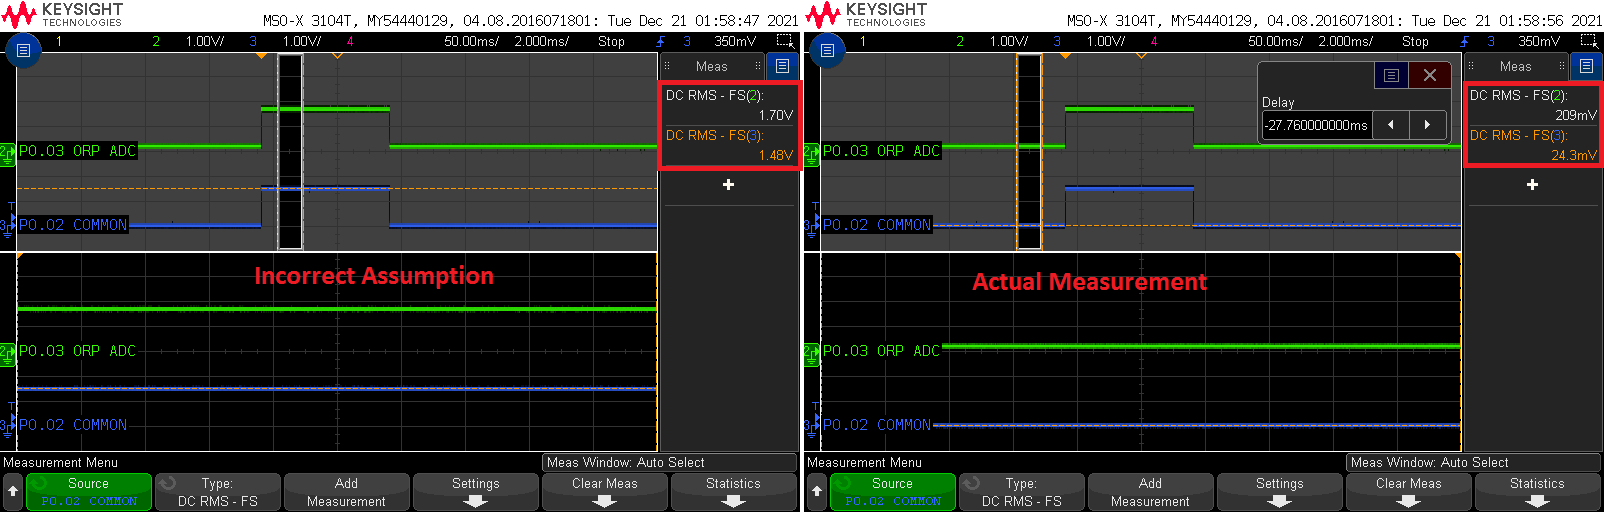
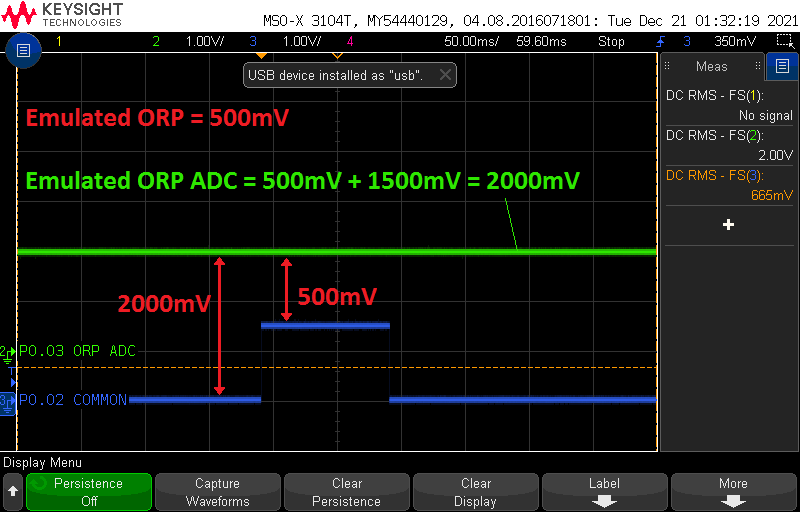
When using the emulator, the probe is emulated by applying a voltage referenced to ground at J2+, taking into account that the bias is 1500mV. That’s why I add 1500mV to all the values when I emulated them. This only works if the actual ORP measurement is done when the bias is active. If the measurement is done outside this interval, the emulation fails because the emulator applies a voltage on the ORP ADC at all times. As we can see below, if the actual measurement is taken outside the time that P0.02 is biased at 1500mV, then a differential ADC aquisition between P0.03 and P0.02 yields 2000mV instead of 500mV.
Now that we have gotten that out of the way, we can reformulate the encoding of the ORP. The actual probe ORP is given in bytes B8[0:1] | B7[0].
Locating & Decoding the Temperature
Although I designed the emulator to handle temperature as well, I decided against using it because it would require unsoldering the fixed-value resistors on the PCB forming the wheatstone bridge (allowing me to apply an arbitrary voltage to the ADC input). I wanted to avoid altering the PCB more than necessary, so I decided to simply replace the thermistor leads by resistors of known values, as already explained in Temperature Front-End Schematics, and leave the wheatstone bridge untouched.
After 3 points, we can see data changing in the first 3 bytes of the payload:
R (Ohms) |
P0.04 (mV) |
P0.06 (mV) |
Payload |
||
|---|---|---|---|---|---|
Expect. |
Meas. |
Expect. |
Meas. |
||
8.2k |
1332 |
1310 |
1480 |
1460 |
70eb52e1db060002a0ab5c00796987a0525ce257 |
10k |
1480 |
1460 |
1480 |
1460 |
827b5ce141c70002a60b5d00796987a0525ce257 |
11k |
1551,4 |
1520 |
1480 |
1460 |
706b60e1e16600029aab5c00796987a0525ce257 |
Note
the pH and ORP inputs were left floating, so data in bytes 6, 7 and 8 are not fixed but we will ignore that.
There are some variations of data in bytes 2, 3, 4, 10, 11 and 12:
R (Ohms) |
Payload |
|||||
|---|---|---|---|---|---|---|
B2 |
B3 |
B4 |
B10 |
B11 |
B12 |
|
8.2k |
70 |
eb |
52 |
a0 |
ab |
5c |
10k |
82 |
7b |
5c |
a6 |
0b |
5d |
11k |
70 |
6b |
60 |
9a |
ab |
5c |
944b53e158b22502bbbb2500796987a0525ce257
Rearranging parts of bytes 2, 3 and 4, we can see that:
Bytes
B3[1] | B2[0:1]form a 12 bit value that is close to VDD (but not quite):8.2k: 0xB70 = 2928 mV
10k: 0xB82 = 2946 mV
11k: 0xB70 = 2928 mV
Bytes
B4[0:1] | B3[0]are very close to the voltage of P0.04:8.2k: 0x52E = 1326 mV
10k: 0x5C7 = 1479 mV
11k: 0x606 = 1542 mV
Bytes
B11[1] | B10[0:1]are very close to VDD:8.2k: 0xBA0 = 2976 mV
10k: 0xBA6 = 2982 mV
11k: 0xB9A = 2970 mV
Bytes
B12[0:1] | B11[0]are close to the voltage of P0.06:8.2k: 0x5CA = 1482 mV
10k: 0x5D0 = 1488 mV
11k: 0x5CA = 1482 mV
Given that it is only P0.04 that varies with the unknown resistor, we can spot it easily and safely conclude that is it contained in B4[0:1] | B3[0].
For P0.06, it is less obvious because it does not change. It could be contained in B12[0:1] | B11[0], but it seems strange that these bytes are encoded so far away in the payload from P0.04. As for the two series close to VDD, it is too early to tell exactly where they come from.
We can attempt to spot P0.06 by cheating a little: let’s change the value of R22 from 10k to 15k.
This should produce a voltage of 1200mV instead of 1500mV. We should be able to spot that easily if it is indeed stored in B12[0:1] | B11[0].
For a measured P0.06 of 1168mV (using the scope), we get:
3049 53e1bd6600029d db5c 00796987a0525ce257
We find:
0x930 = 2352 mV in
B3[1] | B2[0:1]. This is actually double the voltage of P0.060x5CD = 1485 mV in
B12[0:1] | B11[0]. This is the same as previously and does not seem to be related to P0.06 after all.
Let’s change R22 again, this time to 22k. P0.06 is measured to be 910mV:
26e7 52e1dbc600029d ab5c 00796987a0525ce257
We find:
0x726 = 1830 mV in
B3[1] | B2[0:1]. Again, this is exactly double the expected voltage of P0.060x5CA = 1482 mV in
B12[0:1] | B11[0]. We definately exclude this from being related to P0.06
With these last two measurements with a different R22, we have found some data that is linked to the voltage of P0.06. However, it is exactly double the value.
Note
read on to Revisiting the Temperature Decoding for a better interpretation.
Seeing that the BLE Advertisement seem to contain the voltages across the wheatstone bridge, we are in the first scenario of the three possible scenarios identified at the end of our previous analysis of the Temperature Front-End Schematics. This implies that a BLE scanner will have to perform the following operations to recover a readable temperature:
Solve the wheatstone bridge equation to recover the resistance of the thermistor
Solve the thermistor’s Beta-model equation to recover the actual temperature
We have everything we need to do this, except the Beta-parameter of the thermistor. This can be anywhere between 3000 and 5000, and can be recovered by performing a 2-point calibration of the temperature. For this, we need a high-precision laboratory thermometer and a controlled-temperature setup, neither of which I have at hand at the moment.
I’m going to take a wild guess here and make the following assumptions:
The R0 parameter of the thermistor is 10k, because the wheatstone bridge uses three 10k resistors.
The T0 parameter of the thermistor is 25°C, since that’s the most common
This means that we can already assume that we have 1 point of data: at 25°C, the resistance is 10k. We need another data point, one which we can do even in the most basic setup without controlled parameters. To do this, I took a glass filled with water that had been lying at room temperature for several hours. I dipped the probe in this water, along with another thermistor of known value I recovered from an old aquarium. I measure the resistance of each thermistor to be very close:
12940 Ohm for pHin
12950 Ohm on my 3950-Beta thermistor, meaning we are at 19.29°C.
I wasn’t expecting to get identical values… could this be also a 3950-Beta thermistor? A 10 Ohm difference could certainly be within the measurement error of my setup. A 10 Ohm difference here produces a 12 unit diffence in the Beta parameter. I don’t know how common a 3950 Beta thermistor is, but I’m going to stick with this value for the Beta of pHin.
Note
If I had used a reference thermistor of different Beta, we could have computed the beta of pHin using the 25°C measurement and the 19.29°C measurement.
Note
The spread beween 19.29 and 25 is not much, so we could be in a linear zone but get larger difference at higher or lower temperatures. I should try to get a more reliable setup to chacterize it more rigorously.
Revisiting the Temperature Decoding
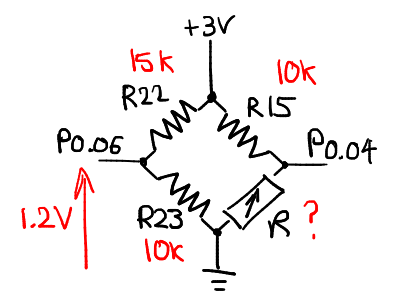
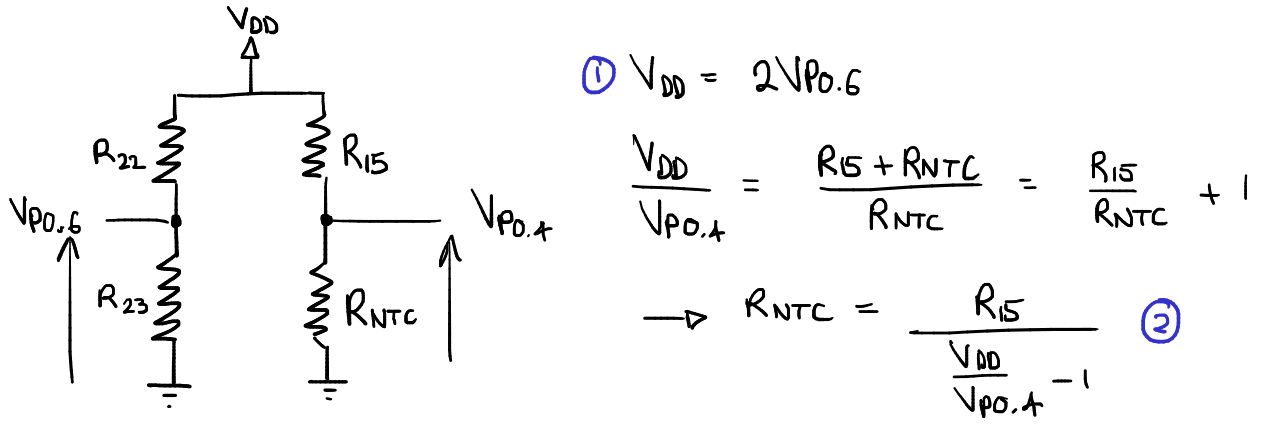
A few days after releasing this initial document, I came back to the issue of decoding the temperature because I still needed to explain why we transport 2VP6 in the BLE Packets instead of VP6. I then realized that there is no real added value of doing the whole wheatstone bridge development, since the temperature measurement could work just as well using the voltage divider formed by R15 and the thermistor, assuming that we know the exact voltage at the top of the wheatstone bridge (i.e. at the output of pin P0.05). This is the role of the extra divider: the microcontroller measures the voltage at pin P0.06 and then multiplies it by 2 to get an accurate value of the voltage on pin P0.05. If the pHin monitor reports the true voltages at pins P0.05 and P0.04, the application can then recover the thermistor’s resistance using a simple voltage divider development:
The wheatstone bridge equations given in the previous section and the simpler voltage divider interpretation give equivalent results, but this new interpretation is probably closer to what the developers had in mind. The information in The near-complete, decoded pHin BLE Interface has been updated accordingly, with simpler formulas.
Locating & Decoding the Battery Voltage
The battery voltage (or remaining %) must be encoded somewhere to report the battery status to the user. While attempting to decode the temperature data, I noticed something close to VDD in B11[1] | B10[0:1].
Let’s make small changes to VDD and observe the value of those fields:
VDD (mV) |
|
Decimal (mV) |
|---|---|---|
3000 |
0xBB8 |
3000 |
2900 |
0xB5B |
2907 |
2800 |
0xAF5 |
2805 |
2700 |
0xA8F |
2703 |
Our Updated Data Mapping
Offset |
Length |
Data Type |
Format |
Comment |
|---|---|---|---|---|
0 |
2 |
Manufacturer ID |
uint16, LE |
|
2 |
3 |
Temperature |
2x uint12 |
VP0.04 and VP0.06x2 spread over 3 bytes |
5 |
1 |
Unknown |
||
6 |
3 |
pH & ORP |
2x uint12 |
pH and ORP, spread over 3 bytes |
9 |
1 |
Sequence Number |
uint8 |
Measurement sequence number, 0-255 |
10 |
2 |
Battery Voltage |
uint12 |
In B11[1] and B10[0:1], B11[0] unknown |
12 |
2 |
Unknown |
||
14 |
6 |
Bluetooth Address |
6 bytes |
The Bluetooth Addr, with 1 bit difference |
20 |
2 |
Unknown |
= |
I expect to find production-related information in the other bytes. There could be some information here that’s also displayed on the prouct label. I didn’t go any further in trying to complete the missing fields, because all the pool-related information is here.